<< BO Online Help >>
MONITORING
MAINTENANCE
REMOTE ADMINISTRATION
REPORT
VIEW
HELP

DATE: 2025-12-16 TIME: 00:13:04
REPORTS / PATRON REPORT
| This help file covers the following topics: | |
|
|
You have the option of creating this report for a single property or for multiple properties.

Note: This page provides information on the single property report. For information on the mulitple property report click here.
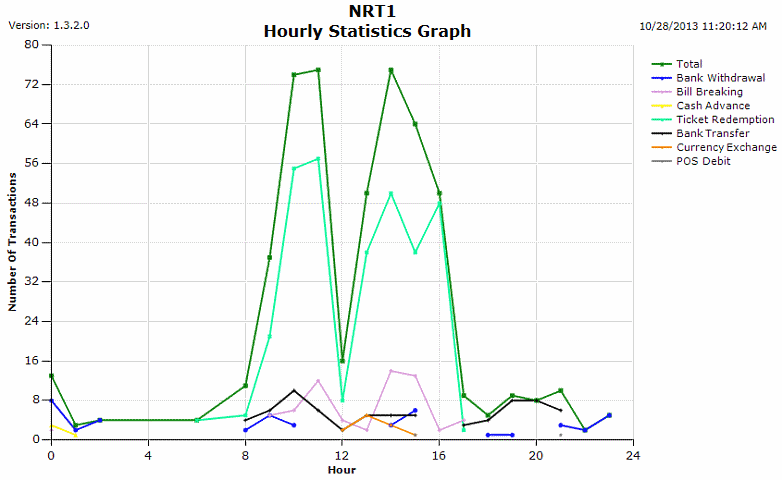
This graph shows the average number of transaction per hour for patron transactions between "0" and "24" hours. Transactions are grouped by transaction type with the average number of transactions provided for each transaction type selected.
Here's an example of a Hourly Statistics Graph.

The sort order is Transaction Type.
| Notes: | The number of transaction types displayed will depend on the date range, machines, and transaction types selected. |
 This toolbar provides refresh, search, export, print, page navigation etc.
| 1. Preview | Preview will display the report as a PDF file in the browser window. |
| 2. Style | Select style of report. (color | gray scale | no fill) |
| 3. Open All | Select "Yes" to expand and show detail lines for all collapsed sections. (with (+) sign) |
| 4. Rpt Format | Select report format (e.g. PDF, Excel) from list, then click GO to export report in selected format. |
| 5. Navigation | Use navigation controls to step forward or backward through report pages. |
| 6. Parent Rpt | Return to parent report. (if currently within child report) |
| 7. Search | Enter search string and then use find and next to step through matches. (case-insensitive) |
| 8. Refresh | Refresh report reloading with current data. |
| 9. + Print | Open print dialog box so that you can specify print options. (must install "print control" first!) |
Here's a screenshot of the single property filter screen.

| 1. * Date Range | Select a date range to filter on (or) go with the default (gaming day). |
| 2. + Machine | Select any machines which you would like to filter on. (see notes below) |
| 3. + Mach Group | Select any machine groups you would like to filter on. (see notes below) |
| 4. + Mach Location | Select any machine locations you would like to filter on. (see notes below) |
| 5. Transaction Type | Select transaction type(s) you wish to filter on. (none selected = all trans types) |
| Submit button will generate and display a graph in html format showing the HTML report toolbar. |
| Notes: | 1. * | The default date range is based on the GamingDayStart and GamingDayEnd system parameters. | |
| 2. * | You can enter a new date using the format yyyy/mm/dd (or) select one using the calendar tool. | ||
| 3. + | These lists are automatically populated with the machines, groups and locations for the current property. | ||
| 4. + | If no machines, groups or locations selected, the report is based on all machines for the current property. | ||
| 5. + | The Unit IDs which match the selected machines (or) groups (or) locations are included in the report. | ||
| 6. + | You can select more than one machine, group, or location within a list by using Ctrl+Click or Shift+Click. |
 |
Click in the textbox to display the calendar tool. Use the "<" and ">" links to navigate to the previous or the next month. Click on a day within the month displayed to change the date. |
|
|