<< BO Online Help >>
MONITORING
MAINTENANCE
REMOTE ADMINISTRATION
REPORT
VIEW
HELP
DATE: 2026-03-20 TIME: 02:14:22
| This help file covers the following topics: | |
|
|
This report provides a snapshot of the card collector and card dispenser counters for the machines selected, as of a specified date and time.
Here's an example of a Card Dispenser (Counters) Report.
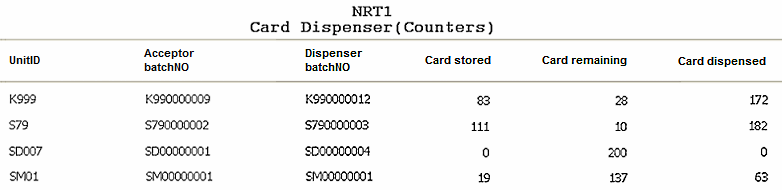
Here's a description of the columns used in this report:
| 1. UnitID | Unit ID identifies the NRT QuickJack unit. |
| 2. Acceptor BatchNo | Acceptor Batch No. is the batch no. for cards collected. |
| 3. Dispenser BatchNo | Dispenser Batch No. is the batch no. for card dispensed. |
| 4. Card Stored | Number of cards stored in the card collector bin. |
| 5. Card Remaining | Number of cards remaining in card dispenser bin. |
| 6. Card Dispensed | Number of cards dispensed from the card dispenser bin. |
The default sort order is Unit ID.
| Notes: | 1. | The card acceptor batch no. is incremented when the card collector bin is emptied. | |
| 2. | The card dispenser batch no. is incremented when the card dispenser bin is replenished. |
Here's a screenshot of the report filter screen.
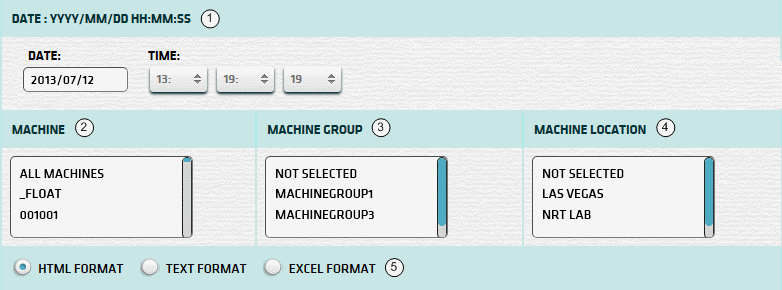
| 1. Date and Time | Select a date and time to filter on (or) go with the default (current date and time). |
| 2. + Machine | Select any machines which you would like to filter on. (see notes below) |
| 3. + Mach Group | Select any machine groups you would like to filter on. (see notes below) |
| 4. + Mach Location | Select any machine locations you would like to filter on. (see notes below) |
| 5. Output Format | Output Format can be either HTML, TEXT, or EXCEL. For more info see Report Formats. |
| Submit button will generate/display report. See Report Generation for more information. |
| Notes: | 1. * | You can enter a date (or) select one using the calendar tool. (Click here for more info) | |
| 2. + | These lists are automatically populated with the machines, groups and locations for the current property. | ||
| 3. + | If no machines, groups or locations selected, the report is based on all machines for the current property. | ||
| 4. + | The Unit IDs which match the selected machines (or) groups (or) locations are included in the report. | ||
| 5. + | You can select more than one machine, group, or location within a list by using Ctrl+Click or Shift+Click. |
When you click the submit button the report is generated, displayed in browser, and the show report button appears.
| Click this button if you wish to redisplay the report just generated. |
| Notes: | 1. | The show report button shows the size of the report that has been generated. (e.g. '362K') | |
| 2. | The show report button will display report already generated, so it saves both time and resources. |
 |
Click in the textbox to display the calendar tool. Use the "<" and ">" links to navigate to the previous or the next month. Click on a day within the month displayed to change the date. |
|
|